Webサーバー比較の方法
サーバー構築の方法
Procmox VE の仮想環境で、debian LXC で 3台のサーバー(CPU 2 , メモリー 2GB , スワップ 512MB )を作って、それぞれ Apache2 . Nginx . OpenLitespeed と WordPress 環境を構築した。
テスト方法
アパッチベンチ
アパッチベンチで同時アクセスの耐性をチェックする
ab -n 100 -c 100 [URL]
ab -n 100 -c 100 https://nginx.home/
パーソナルサーバー用のテストなので、同時に100アクセスあった場合、どうなるか。
Lighthouse
google Chrome WEBブラウザの
表示 –>. 開発/管理 –> デベロッパーツール
にある Lighthouse を使う。
Desktop と Mobile の2種類の測定が可能だが、今回は、Mobile のみの比較とした。
WordPress テーマ Twenty Twenty-Four
Lighthouse で計測するページは、wordpress のテーマ Twenty Twenty-Four を使いました。
HTML transferred: 8033900 bytes = 8.0339Mバイト
程度のページサイズです。

インストールした状態の比較
http アクセス
ab -n 100 -c 100 [URL]
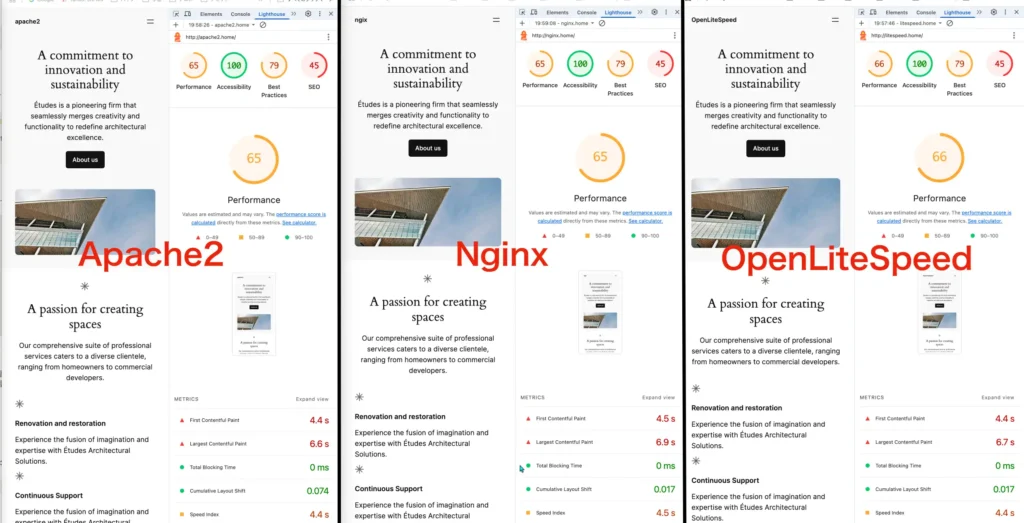
左から apache2 nginx litespeed となっている。
http://apache2.home/
Servee: Apache/2.4.62
Hostname: apache2.home
Server Port: 80
Document Path: /
Document Length: 80339 bytes
Connection Times (ms)
min mean[+/-sd] median max
Connect: 1 5 2.6 5 11
Processing: 85 1075 561.2 1126 1936
Waiting: 73 1069 561.6 1119 1935
Total: 86 1080 558.8 1131 1938
Percentage of the requests served within a certain time (ms)
50% 1131
66% 1421
75% 1595
80% 1694
90% 1855
95% 1924
98% 1930
99% 1938
100% 1938 (LR)
http://nginx.home/
Server: nginx/1.22.1
Hostname: nginx.home
Server Port: 80
Document Path: /
Document Length: 80324 bytes
Connection Times (ms)
min mean[+/-sd] median max
Connect: 1 5 2.1 4 9
Processing: 49 872 499.9 882 1709
Waiting: 42 870 500.0 878 1708
Total: 53 877 497.9 887 1710
Percentage of the requests served within a certain time (ms)
50% 887
66% 1161
75% 1307
80% 1402
90% 1568
95% 1671
98% 1692
99% 1710
100% 1710 (LR)
http://litespeed.home/
Server: LiteSpeed
Hostname: litespeed.home
Server Port: 80
Document Path: /
Document Length: 80417 bytes
Connection Times (ms)
min mean[+/-sd] median max
Connect: 1 4 1.7 4 7
Processing: 46 862 422.0 918 1585
Waiting: 37 857 425.2 911 1584
Total: 47 866 420.7 920 1586
Percentage of the requests served within a certain time (ms)
50% 920
66% 1090
75% 1224
80% 1291
90% 1454
95% 1520
98% 1553
99% 1586
100% 1586 (LR)
3つとも大きく異なることはないが、同時アクセスのパフォーマンスは、
- Litespeed1.8.4
- nginx1.22.1
- apache2.4.62
の順となっているが、
結論として、標準インストール状態で3つのウエブサーバーのパフォーマンスの違いは極めて少ない。
Lighthouse
Apache2
First Contentful Paint
4.4 s
Largest Contentful Paint
6.6 s
Total Blocking Time
0 ms
Cumulative Layout Shift
0.074
Speed Index
4.4 s
Nginx
First Contentful Paint
4.5 s
Largest Contentful Paint
6.9 s
Total Blocking Time
0 ms
Cumulative Layout Shift
0.017
Speed Index
4.5 s
LiteSpeed
First Contentful Paint
4.4 s
Largest Contentful Paint
6.7 s
Total Blocking Time
0 ms
Cumulative Layout Shift
0.017
Speed Index
4.4 s
標準状態のウエブサーバーでは、サイトのページの表示スピードにおいて、
実際は、3つのウエブサーバーには、ほとんど誤差範囲のパフォーマンスの違いしかなかった。
https アクセス
それぞれのキャッシュを有効
open ssl を使ったりして、httpsでアクセスしてみた。また、キャッシュを有効にして比べることにした。
ここからは、Nginx と Litespeed だけにした。(面倒になってきたからだ)
ab -n 100 -c 100 [URL]
http2 と それぞれのキャッシュを有効にし、Zip ONにして圧縮した結果だ。
% ab -n 100 -c 100 https://nginx.home/
Server Software: nginx/1.22.1
Server Hostname: nginx.home
Server Port: 443
SSL/TLS Protocol: TLSv1.2,ECDHE-RSA-CHACHA20-POLY1305,2048,256
Server Temp Key: ECDH X25519 253 bits
TLS Server Name: nginx.home
Document Path: /
Document Length: 80300 bytes
Concurrency Level: 100
Time taken for tests: 0.176 seconds
Complete requests: 100
Failed requests: 0
Total transferred: 8053700 bytes
HTML transferred: 8030000 bytes
Requests per second: 569.15 [#/sec] (mean)
Time per request: 175.701 [ms] (mean)
Time per request: 1.757 [ms] (mean, across all concurrent requests)
Transfer rate: 44763.21 [Kbytes/sec] received
Connection Times (ms)
min mean[+/-sd] median max
Connect: 7 108 21.3 95 133
Processing: 21 46 19.3 59 148
Waiting: 2 28 13.5 39 40
Total: 151 155 2.9 154 162
Percentage of the requests served within a certain time (ms)
50% 154
66% 155
75% 157
80% 158
90% 159
95% 160
98% 161
99% 162
100% 162 (longest request)
% ab -n 100 -c 100 https://litespeed.home/
Server Software: LiteSpeed
Server Hostname: litespeed.home
Server Port: 443
SSL/TLS Protocol: TLSv1.2,ECDHE-RSA-AES128-GCM-SHA256,2048,128
Server Temp Key: ECDH X25519 253 bits
TLS Server Name: litespeed.home
Document Path: /
Document Length: 80514 bytes
Concurrency Level: 100
Time taken for tests: 0.195 seconds
Complete requests: 100
Failed requests: 0
Total transferred: 8097700 bytes
HTML transferred: 8051400 bytes
Requests per second: 511.96 [#/sec] (mean)
Time per request: 195.328 [ms] (mean)
Time per request: 1.953 [ms] (mean, across all concurrent requests)
Transfer rate: 40485.29 [Kbytes/sec] received
Connection Times (ms)
min mean[+/-sd] median max
Connect: 7 105 20.8 91 132
Processing: 51 76 19.0 90 161
Waiting: 1 25 14.9 38 39
Total: 168 181 2.1 181 184
Percentage of the requests served within a certain time (ms)
50% 181
66% 182
75% 182
80% 183
90% 183
95% 184
98% 184
99% 184
100% 184 (longest request)
キャッシュを有効にすると、キャッシュなしに比べると、同時アクセスにおいて 10倍くらい高速にこなせるようになった。
- nginx1.22.1
- apache2.4.62
になって、少し逆転する結果になった。まあ、誤差範囲ではあるが。
同時アクセスでも遅延の少ないウエブサーバーが実現したと言える。
Lighthouse
Lighthouse の結果は、標準インストールのデフォルトの値とあまり変化しなかった。
- キャッシュなし パフォーマンス 65 – 66
- キャッシュあり パフォーマンス 68 -69
くらいの変化しかなかった。(いずれも Mobile の場合)
Nginx (http2 Fastcgicache)
First Contentful Paint 3.9 s
Largest Contentful Paint 5.9 s
Total Blocking Time 0 ms
Cumulative Layout Shift 0.074
Speed Index 3.9 s
Litespeed(http2 cache)
First Contentful Paint 3.9 s
Largest Contentful Paint 5.9 s
Total Blocking Time 0 ms
Cumulative Layout Shift 0
Speed Index 3.9 s
パフォーマンスは
- Nginx 68点
- LiteSpeed 69点
Litespeed の方がほんの少し良かっただけで、誤差範囲であった。
ただし、LiteSpeed の
CLS (Cumulative Layout Shift) 0 – 0.017
がいずれの結果もLiteSpeedが良かったので、CLSで困った場合は、ウエブサーバーを LiteSpeed に変更するのも一つの方法として記憶しておこう。
※ CLS ページで発生するレイアウトのずれをスコア化したもの


